Shuijie水结
Measurements of water become the conditions from which a spatial body can form.
2023 · Data-driven artwork · Generative visualization · Virtual exhibition
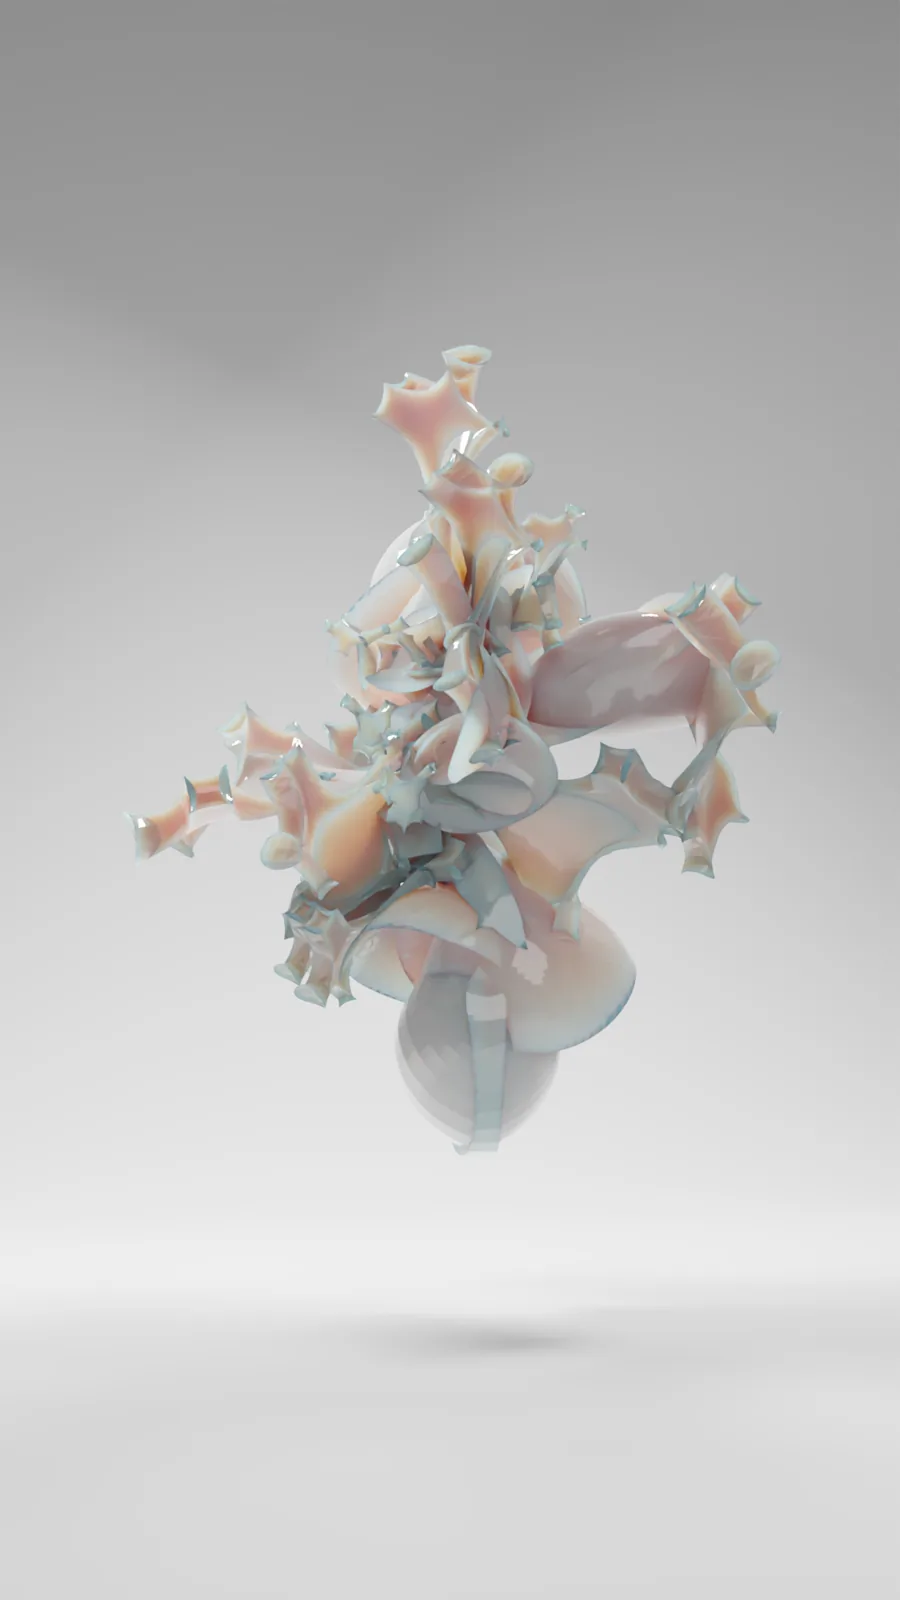
The original exhibition statement begins from an idea attributed there to Nietzsche: “Science is something we add to things.” If that imposed structure were removed, what would remain of the thing itself?
Shuijie is driven by this question. It uses water-quality measurements to generate form — using data to draw the shape of data — while asking whether what remains can still be understood as water itself, even as quantification continually divides water into measurable categories.
Virtual Exhibition
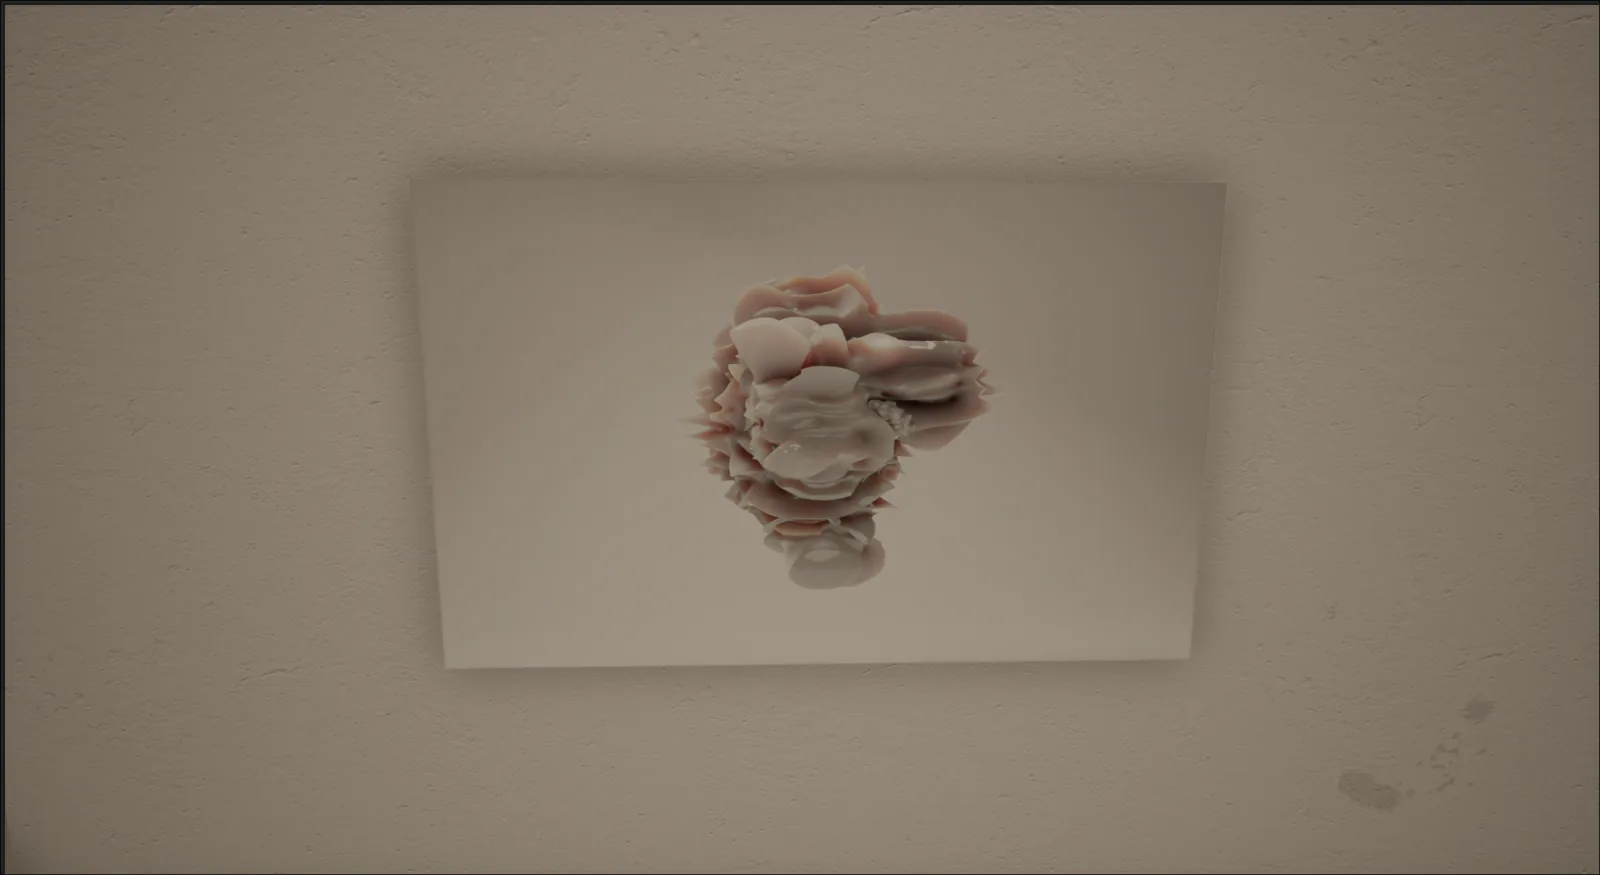
Shuijie was later extended into a real-time virtual exhibition built in Unreal Engine 4. The generated bodies were placed within a navigable architectural space, allowing the work to be encountered spatially as well as through images and visualization.
Virtual Exhibition Stills
Selected views of Shuijie situated within the virtual exhibition architecture.
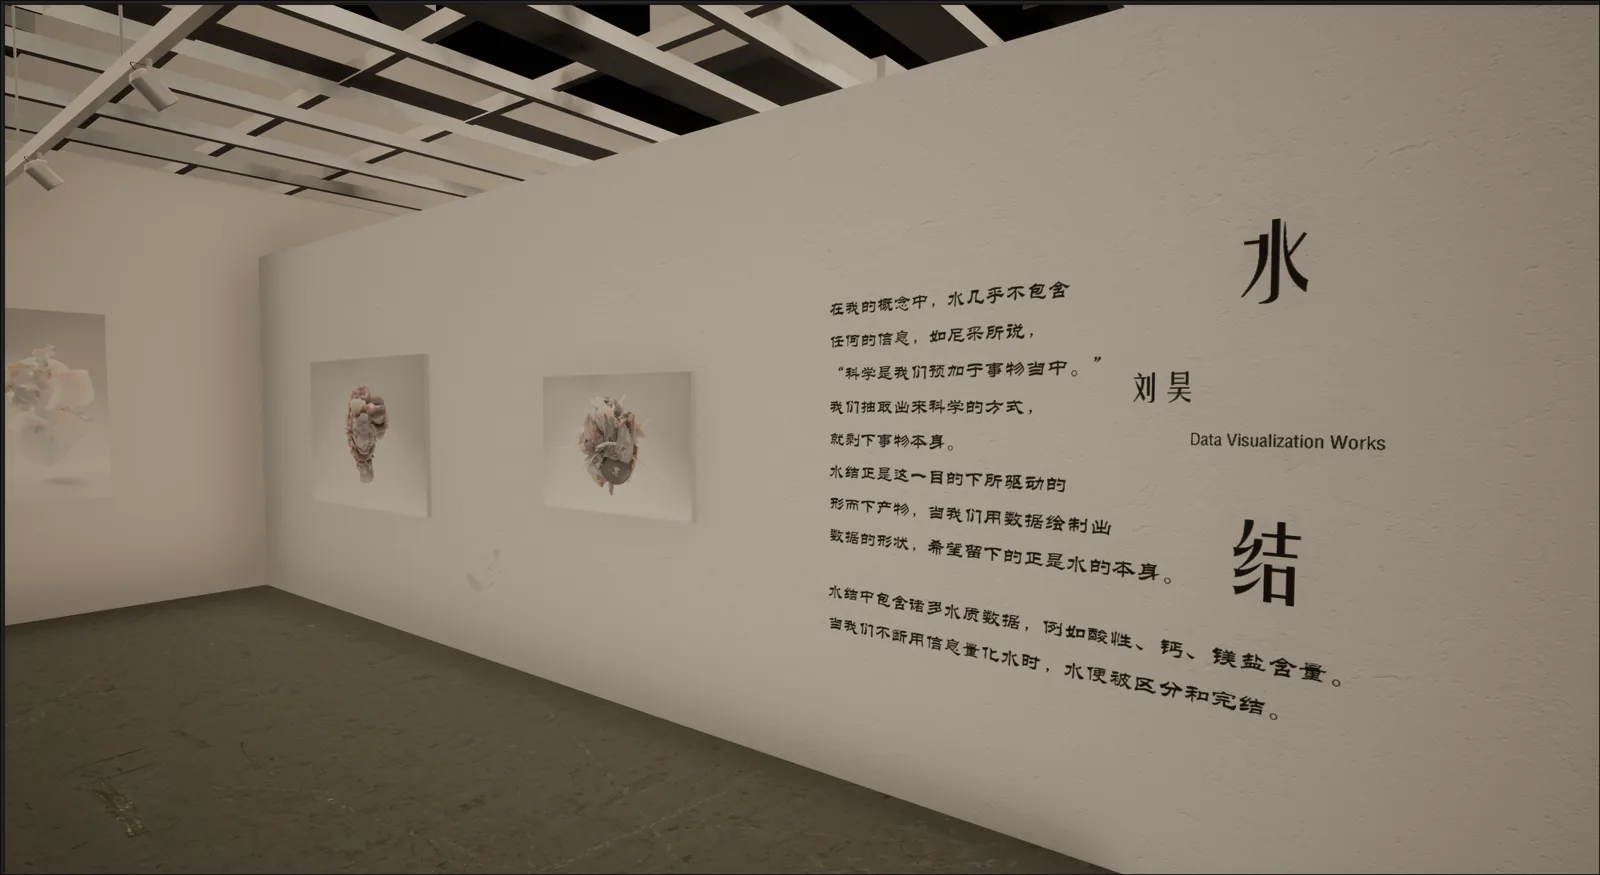
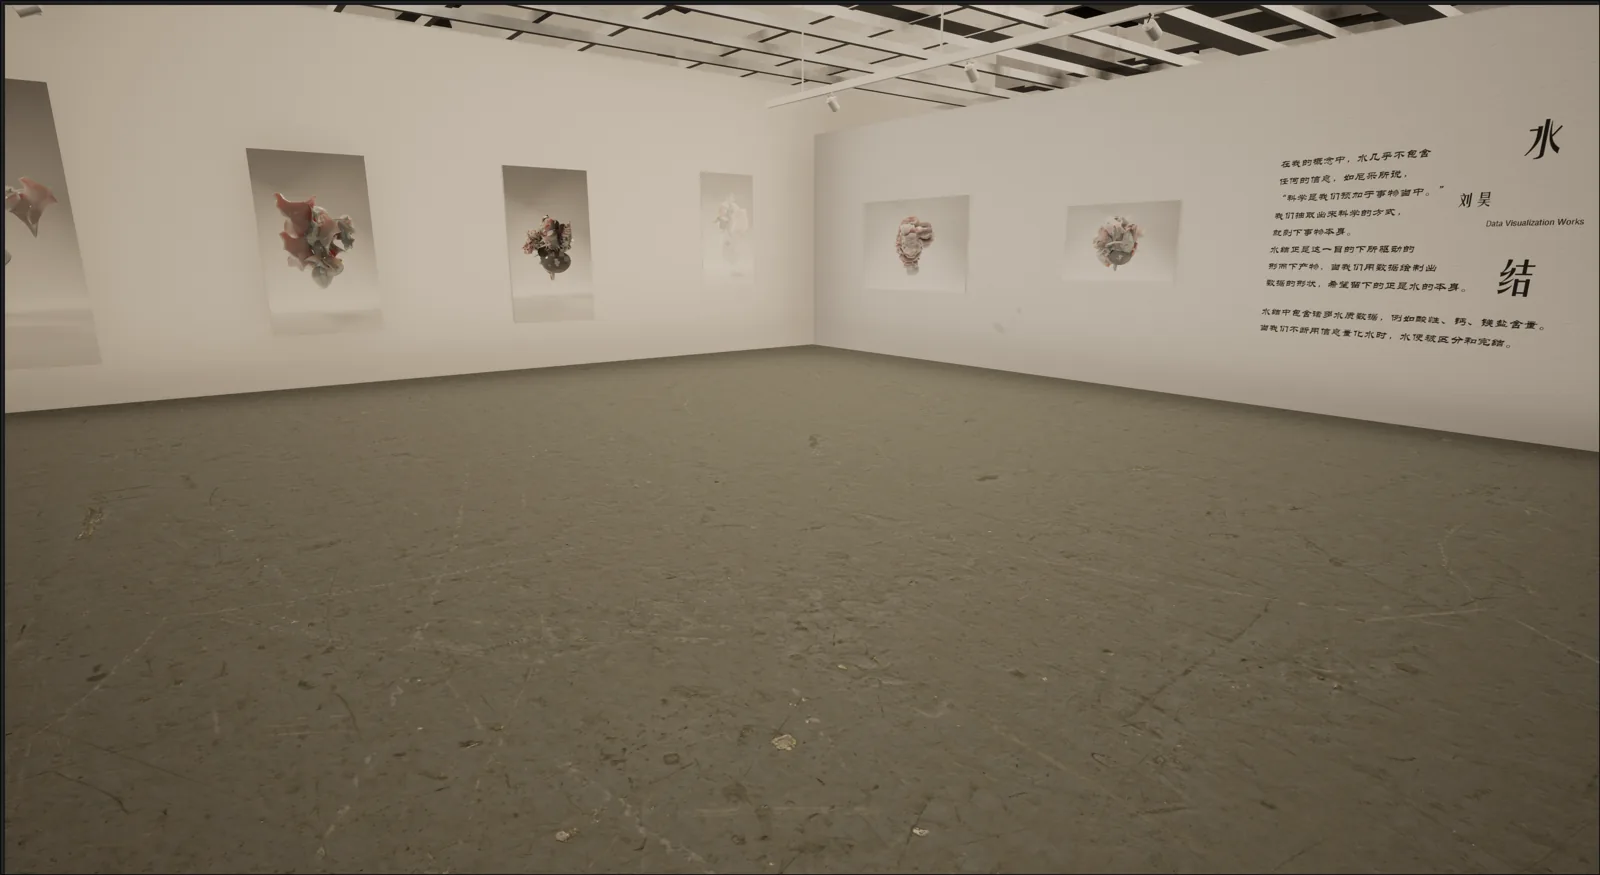
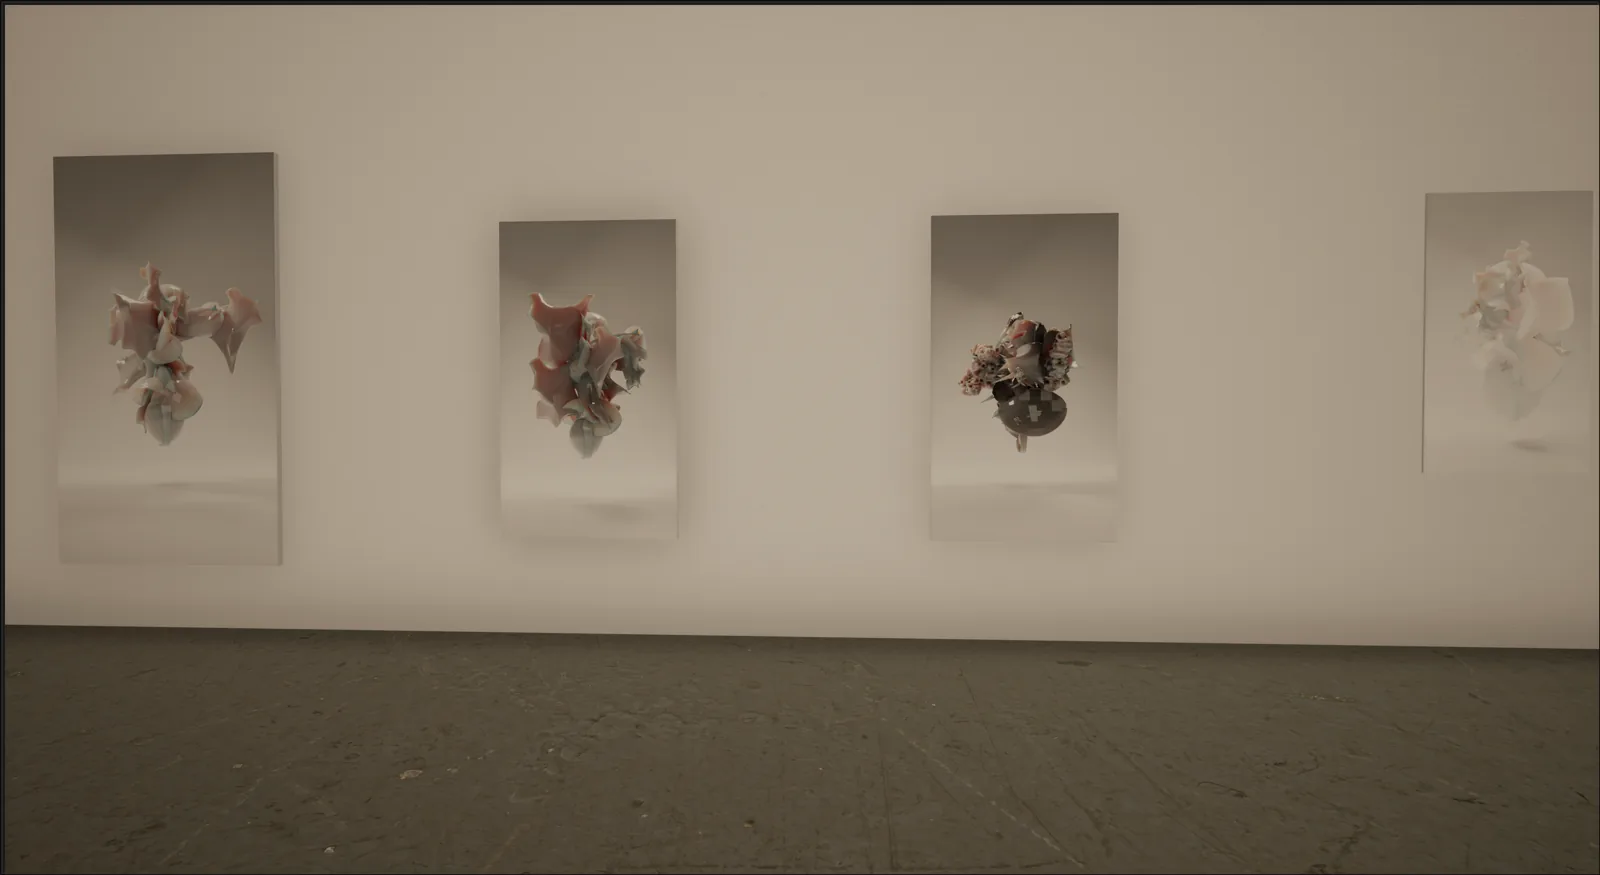
Shuijie transforms measurements of water into spatial bodies, using numerical properties as conditions for visual form.
Water as a Measured Body
Water is commonly encountered as fluid and without a stable form. Within systems of environmental measurement, the same water becomes a collection of numerical properties.
pH, hardness, dissolved solids, chloramines, sulfate, conductivity, organic carbon, trihalomethanes, turbidity and potability describe a body of water largely invisible to direct perception. Shuijie begins with this measured body: not water as it appears to the eye, but water as it becomes legible through data.
From Measurement to Form
The numerical properties in Shuijie are not simply displayed alongside a visual object. Selected measurements determine how that object comes into existence.
The mapping converts measurement into spatial position, colour, transparency and geometry, allowing numerical relations to construct the visual field directly.
Water Body Data Visualization
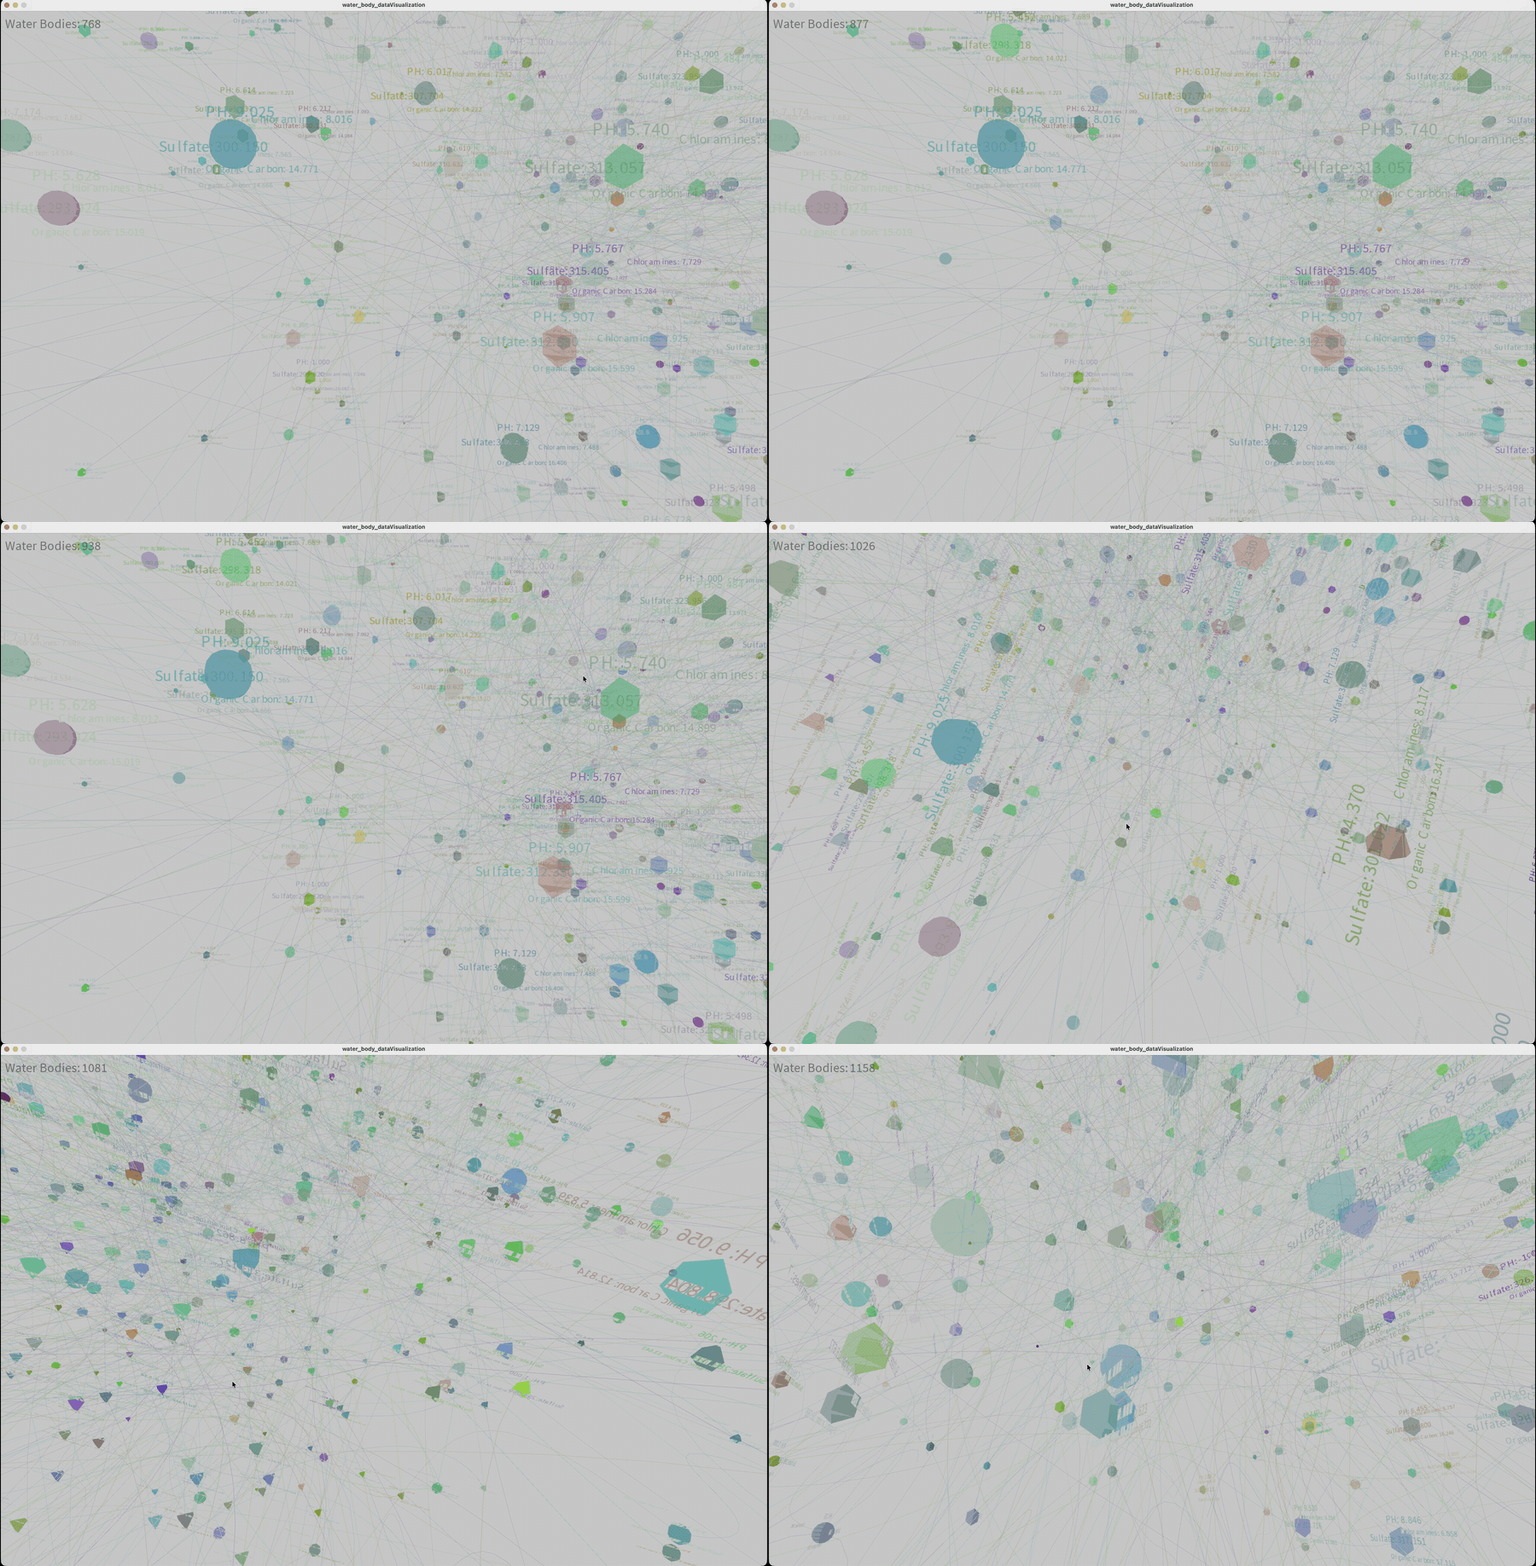
Water Body Data Visualization is the real-time Processing system developed for Shuijie. Water samples enter a three-dimensional field progressively, with measured properties determining their visible form and position.
Generated Bézier trajectories connect successive bodies as the field accumulates. With more samples, individual values become increasingly embedded in a dense structure of bodies, lines and labels.
Shuijie — 水结
The Chinese title combines 水 (shui) — water — with 结 (jie), suggesting joining, condensation and the formation of structure.
In Shuijie, “jie” refers less to a fixed object than to a process through which measured relations take form.
From Continuous Conditions to a Binary Judgment
Most measurements in the dataset occupy continuous ranges, while Potability is expressed as 0 or 1: drinkable or undrinkable.
In Shuijie, this binary classification returns to the spatial body as geometric variation.
Parameter Fields and Generated Bodies
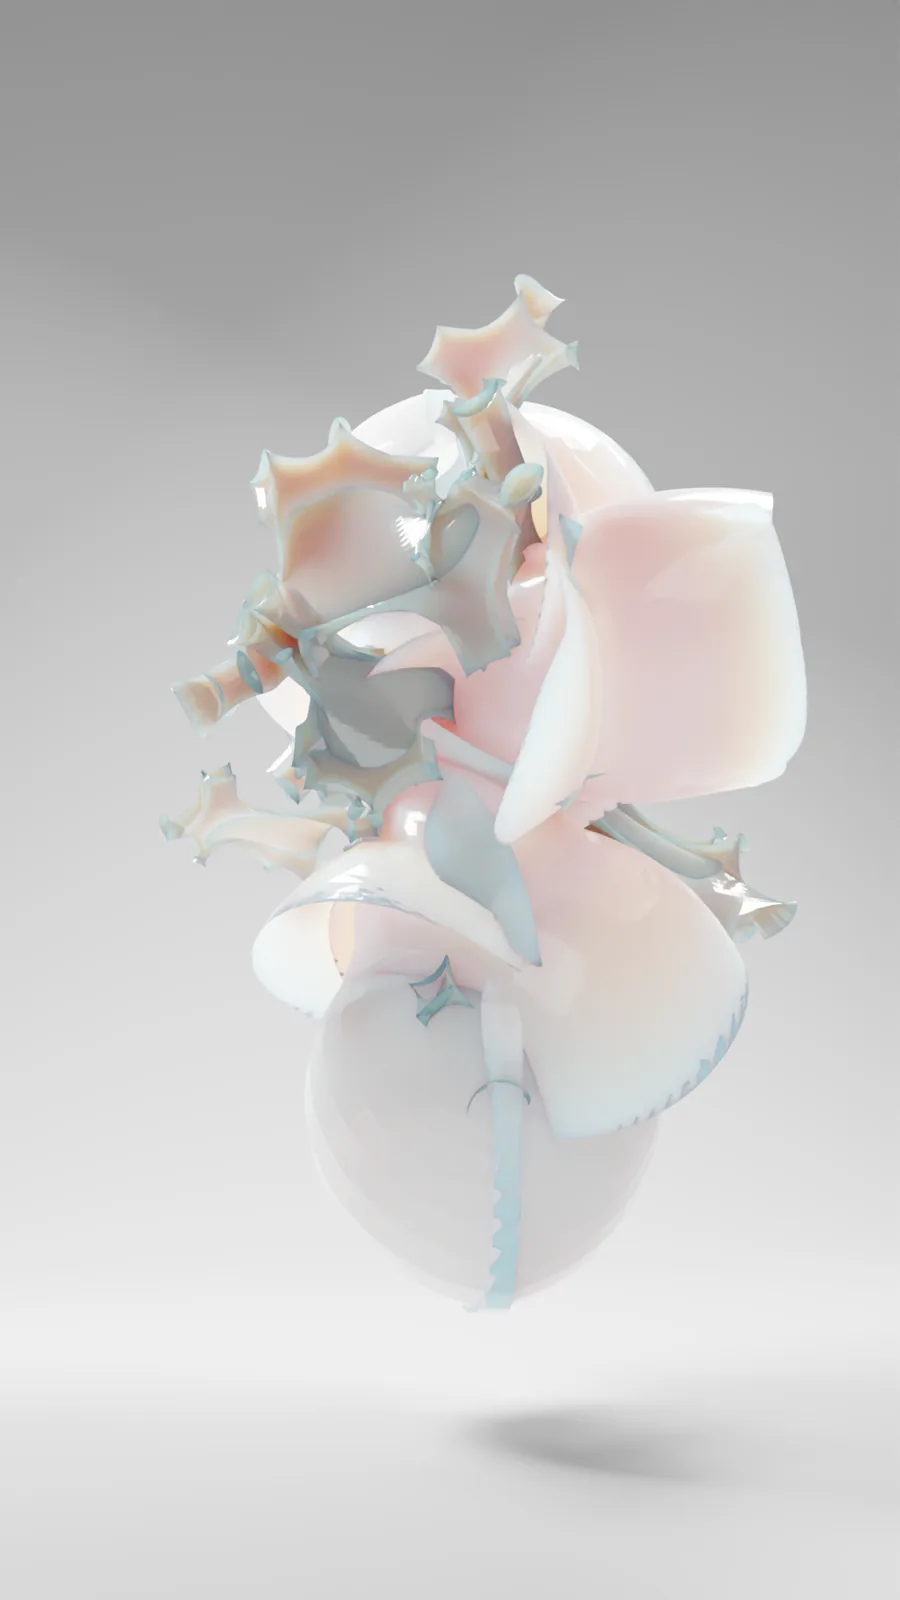
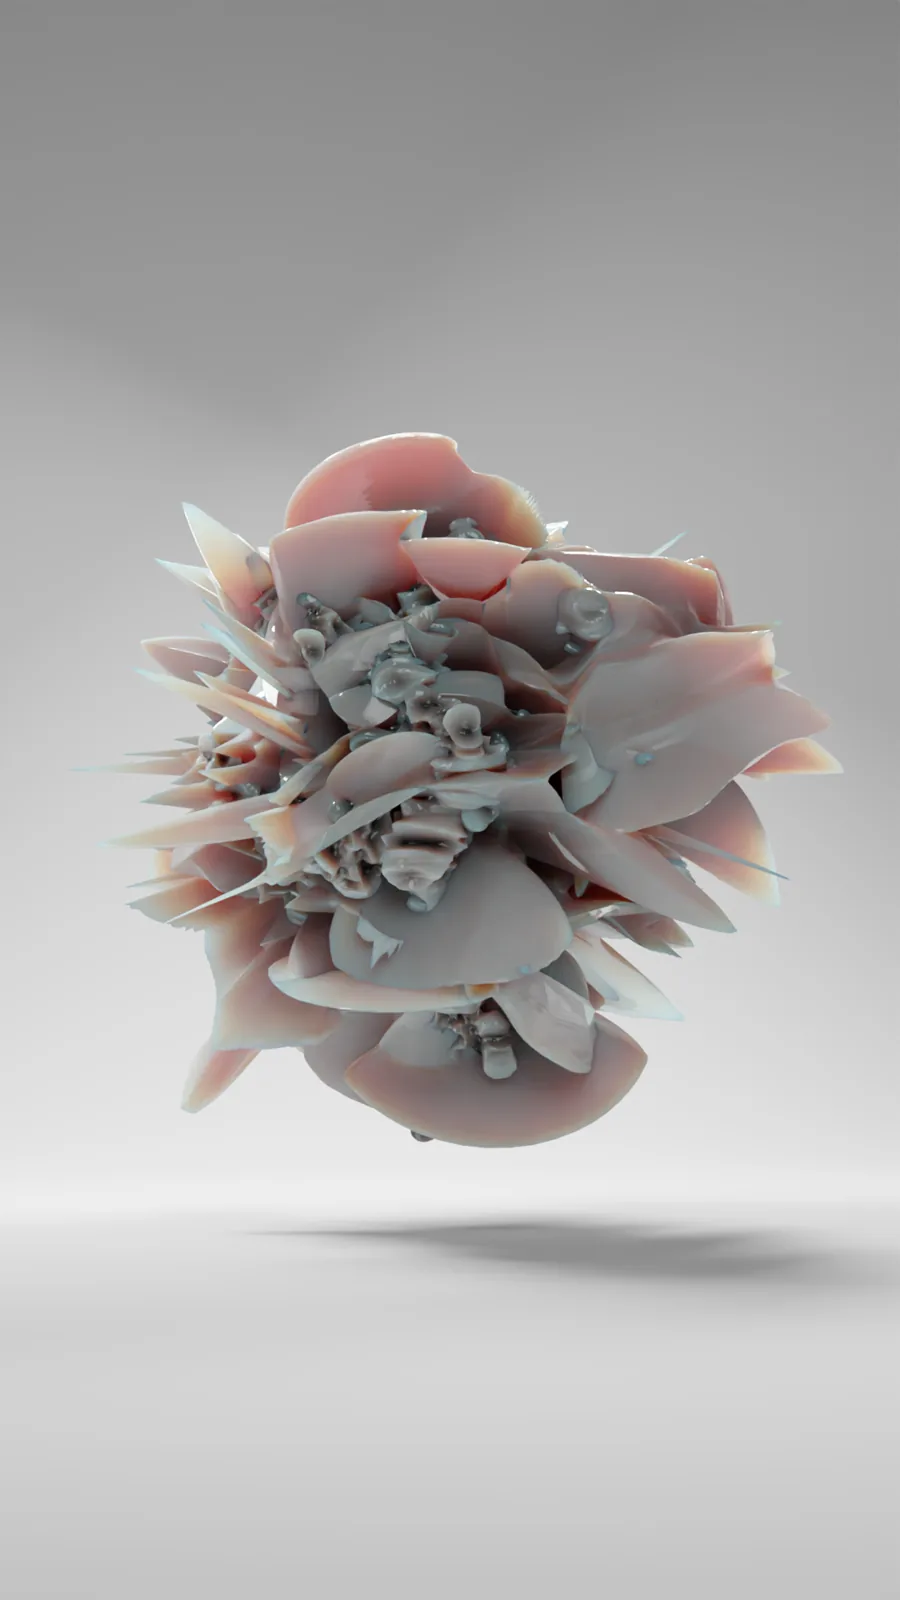
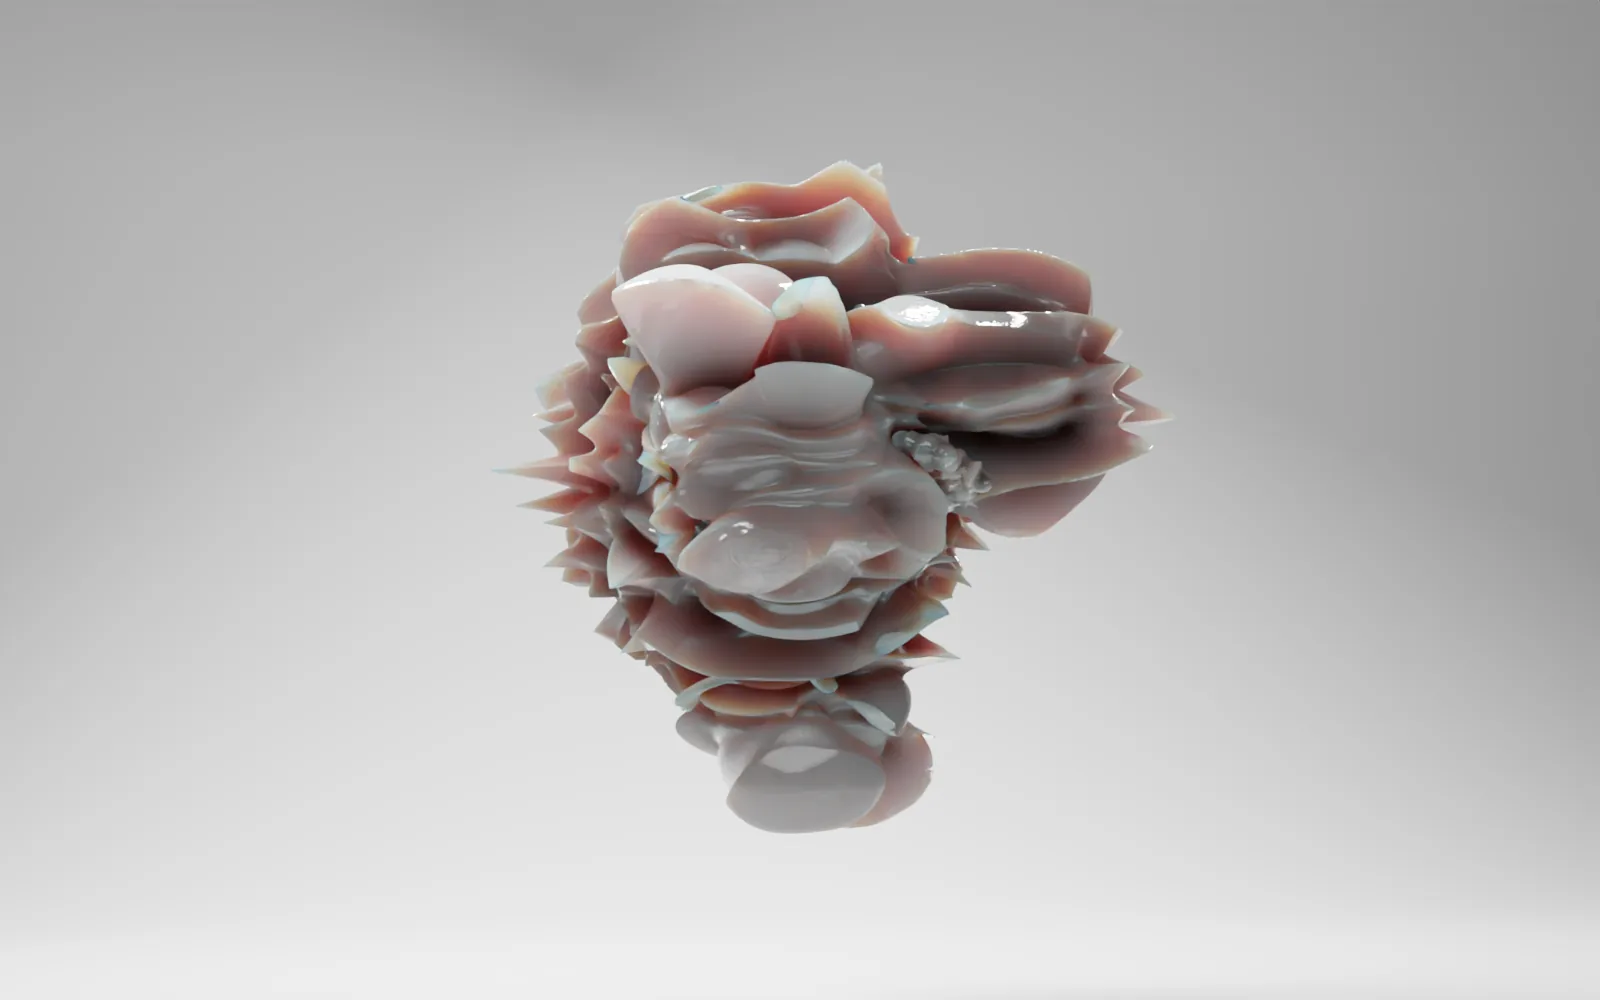
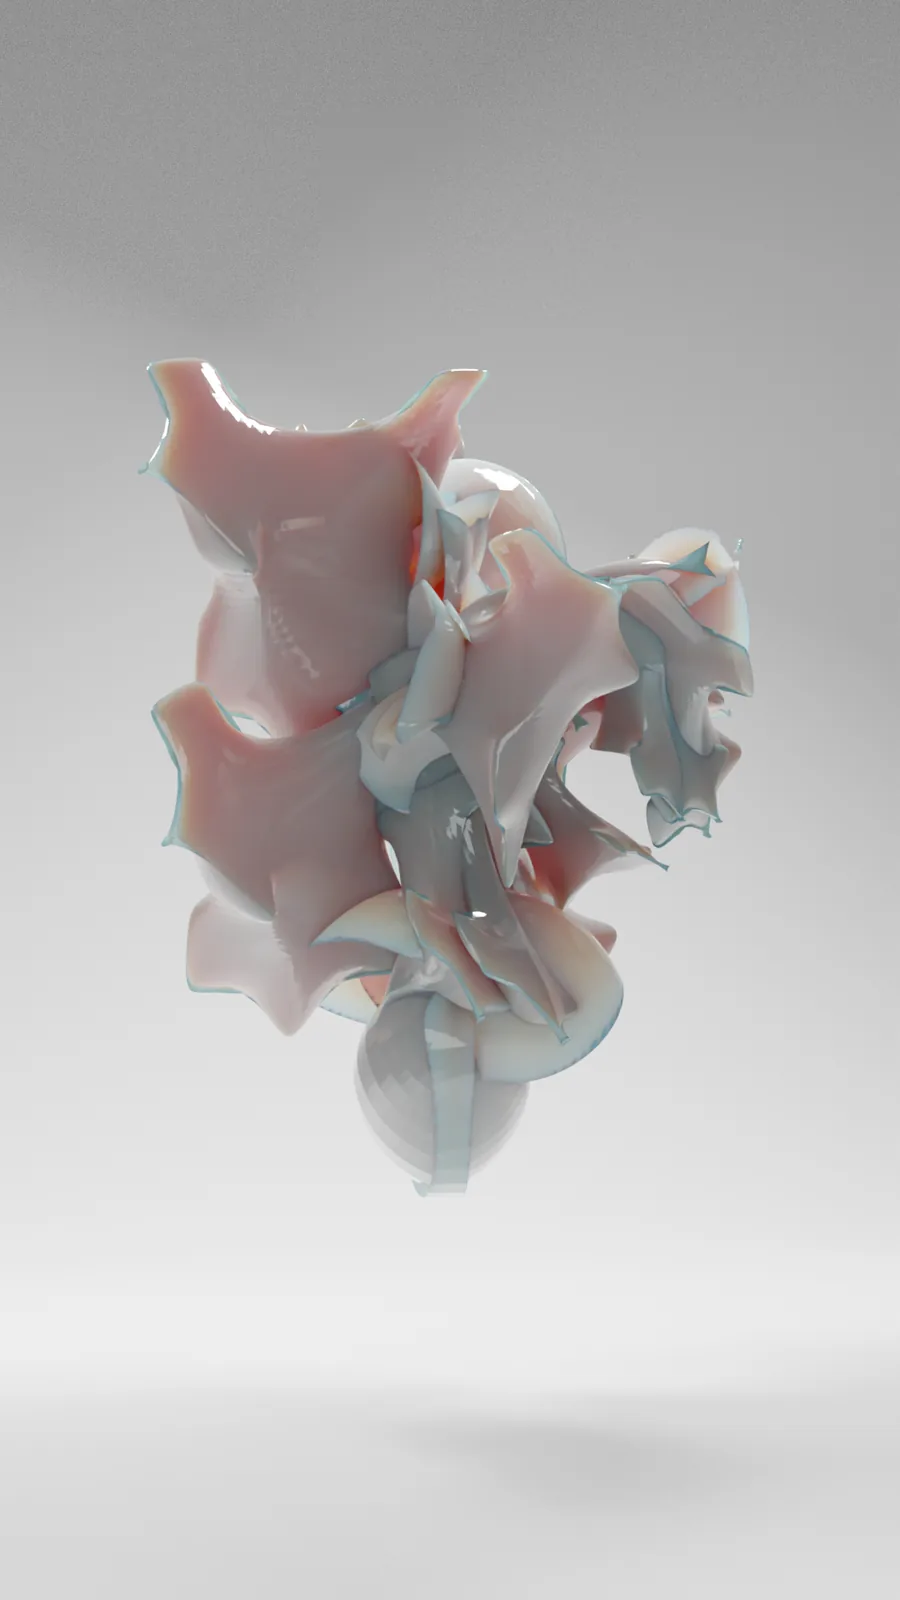
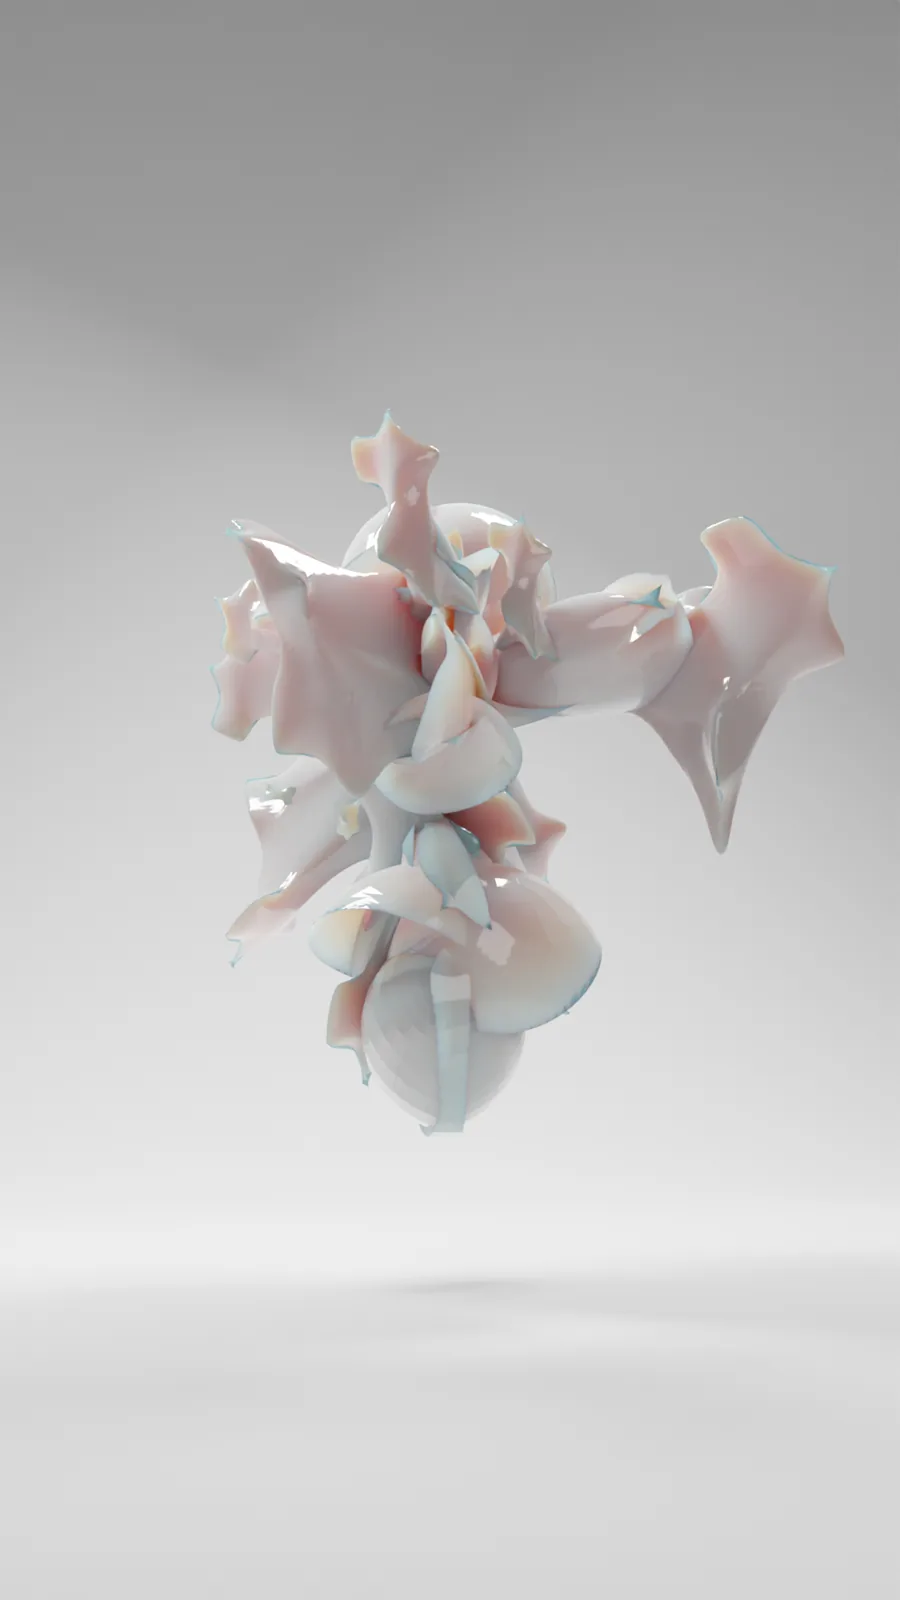
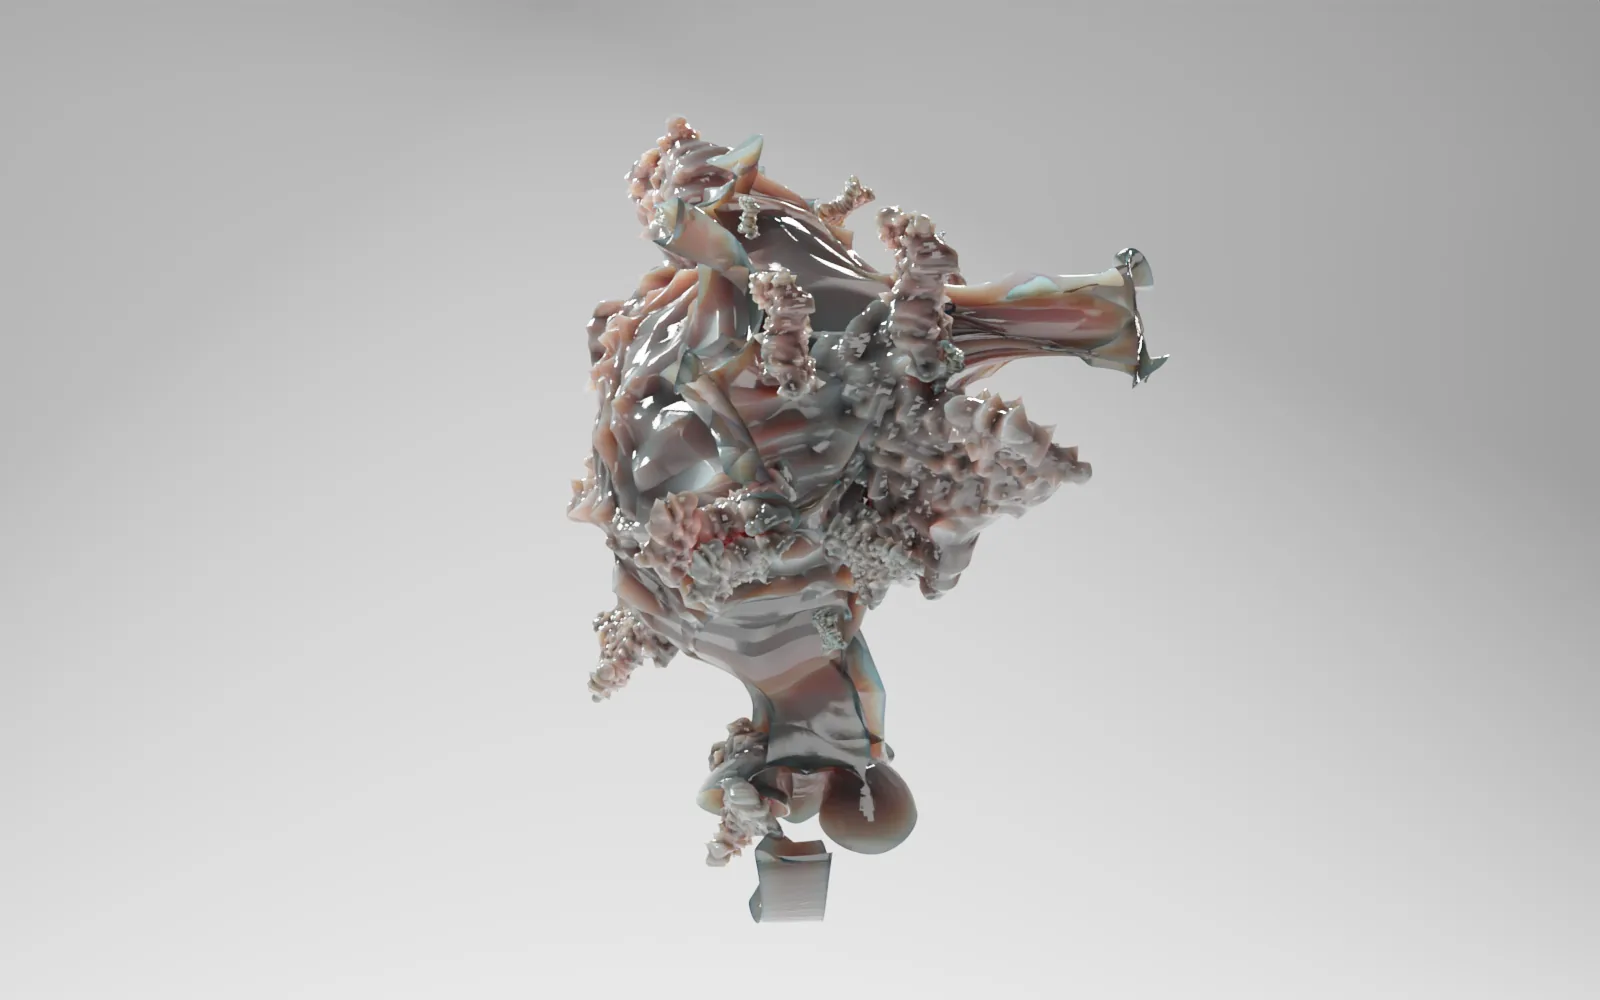
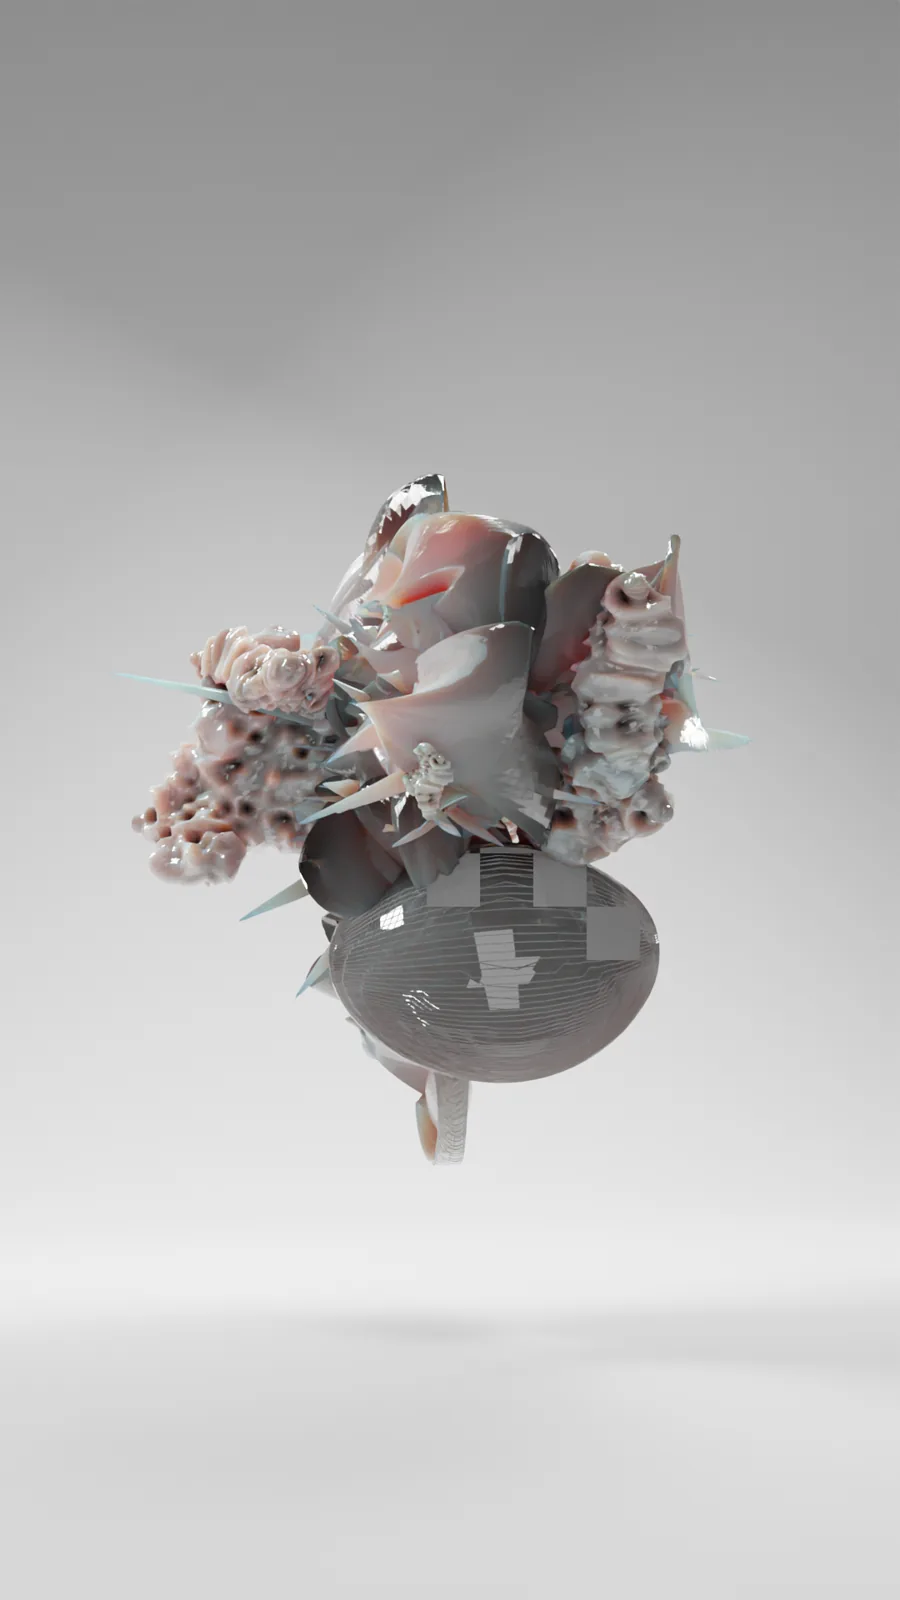
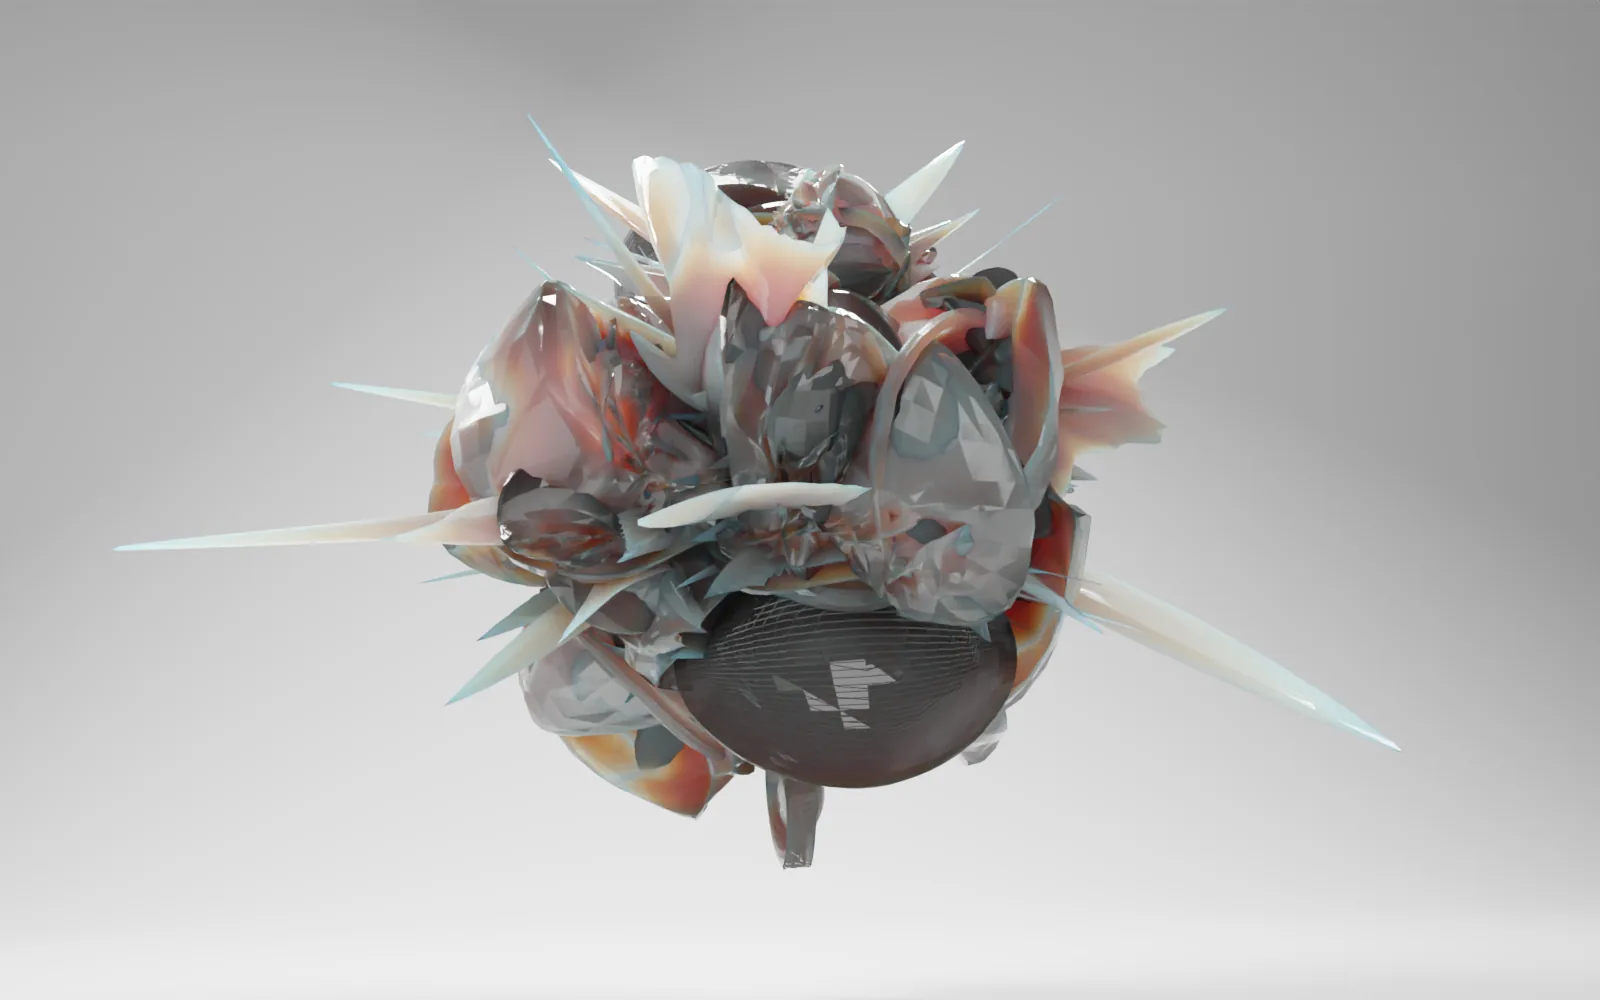
Individual parameters are also converted into compact 32 × 32 grayscale image fields. These parameter-specific images were then developed through Blender into a second family of rendered bodies.
The Processing system produces a field of relations, while the rendered series concentrates individual parameters into distinct computational forms.
Parameter Fields
32 × 32 image fields generated from individual variables in the water-potability dataset.


Generated Bodies
Blender-rendered forms developed from parameter-specific data images.
System
Shuijie was developed across several computational systems.
- DataWater Potability dataset · 3,276 samples · 10 variables
- Data preparationPython · CSV preparation and missing-value handling
- Real-time systemProcessing / P3D / PeasyCam · Water Body Data Visualization
- Parameter fieldsProcessing · 32 × 32 variable-specific images
- Rendered bodiesBlender · parameter-derived visual development
- Virtual exhibitionUnreal Engine 4 · real-time navigable exhibition environment
Work Archive
- Title
- Shuijie / 水结
- Year
- 2023
- Artist
- Liu Hao / 刘昊
- Form
- Data-driven artwork; generative visualization; rendered image series; real-time virtual exhibition
- Data source
- Water Potability dataset ↗
- Dataset
- 3,276 water samples; pH, Hardness, Solids, Chloramines, Sulfate, Conductivity, Organic Carbon, Trihalomethanes, Turbidity, Potability
- Spatial mapping
- Sulfate → X; Organic Carbon → Y; Chloramines → Z
- Visual mapping
- Solids → Red; Trihalomethanes → Green; pH → Blue; Hardness → Transparency; Potability → Geometric variation
- Processing system
- Water Body Data Visualization
- Software
- Python; Processing; Blender; Unreal Engine 4
- Outputs
- Real-time spatial visualization; parameter fields; Blender-generated bodies; Unreal Engine 4 virtual exhibition
- Documentation
- Processing capture; rendered image series; virtual exhibition video and stills